7 Visualization Utilities
| (require gamble/viz) | package: gamble |
This module provides very basic utilities for visualizing data. For more flexible and comprehensive visualization support, see the plot library.
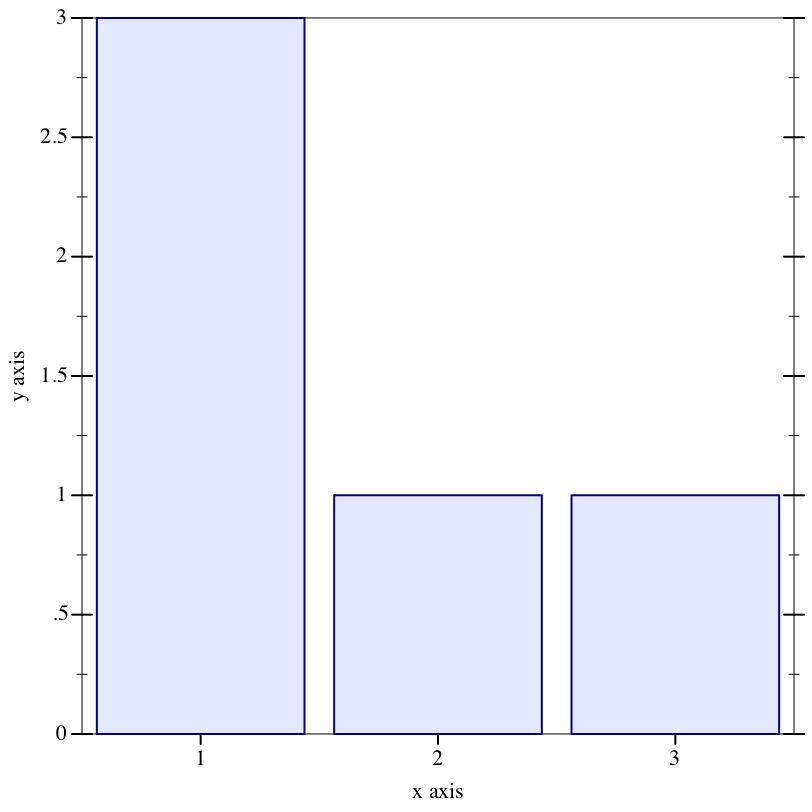
Plots a histogram of vals.
Example: | ||
|
7.1 Multiple Visualizations
| (require gamble/viz/multi) | package: gamble |
|
Interface for displays capable of showing and navigating among
multiple visualizations. Currently all visualizations must be
represented as picts (pict?). See the
pict and plot/pict libraries for
high-level pict constructors, and see the low-level dc pict
constructor for a way of creating a pict from a drawing procedure.
Adds p to the end of the sequence of visualizations.
procedure
(make-multi-viz-frame [#:label label]) → (is-a?/c multi-viz<%>)
label : string? = "Visualization"
Creates a frame that can show multiple visualizations. Add
visualizations with the add-pict method.
(require pict plot/pict) (define mv (make-multi-viz-frame)) (send mv add-pict (plot (function sin (- pi) pi))) (send mv add-pict (circle 400))